DOMINATION REPORT
The Investment Metric That Outperforms All Others
What is the most important metric tied to stock performance?
This is the question I get asked more than any other. People want the silver bullet - that one secret indicator that outperforms all others.
Well, I have the answer.
The complexity of the investment field has made it difficult to determine a “right” answer to this question. Benjamin Graham’s exploration in ‘The Intelligent Investor’ was the first work to provide convincing answers. But the 80 years following the book’s release have seen thousands of ever more complex theories and models all trying to answer this same inherent question. From the Nifty Fifty to the Dogs of the Dow to The Little Book That Beats the Market, it seems like everyone has tried to offer a simple solution that at least temporarily outperforms.
Wall Street has of course taken it several steps further with stock-correlation algorithms, momentum trading systems, and multi-variable back testing. But their long history of excessive fees and embarrassing underperformance leaves little envy for their methods – at least in the minds of sophisticated investors. Most are wise enough to realize that additional complication does not result in superior results.
But given the amount of data and calculation we are now able to perform, it makes sense to re-visit this age old question and finally produce a definitive result.
Two works of research will be referenced in this article. The first is that of analyst Vera Yuan. Her white paper, ‘Earnings, Free Cash Flow, Book Value? Which Parameters Are Stock Prices Most Correlated To?’, examined the stock price correlation to eight fundamental metrics across a full business cycle. Peak-to-peak and trough-to-trough periods between 2000 and 2012 were thoroughly examined in order to determine which analysis metrics produced the highest investment returns. She also compared financial versus non-financial stocks in order to separate these equity classes.
Yuan’s findings for financial stocks are summarized in the table below:
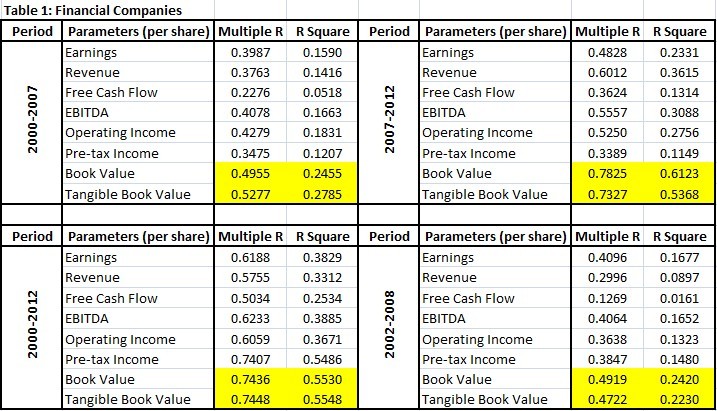
The ‘Multiple R’ and ‘R Square’ figures represent the correlation of the given metric. She explains:
“In statistics, the coefficient of determination, denoted R square, indicates how well data points fit a line or curve. In our case, we use the linear regression. The higher the R square and adjusted R square, the better the stock price change can be explained by the factor change.”
The picture here couldn’t be much clearer. When it comes to banking, investment and other financial stocks, book value is king. Book and tangible book were the consistent winners here across all four market periods.
Non-financial stocks produced similar results, albeit less overwhelmingly than the previous group. These results are summarized below:
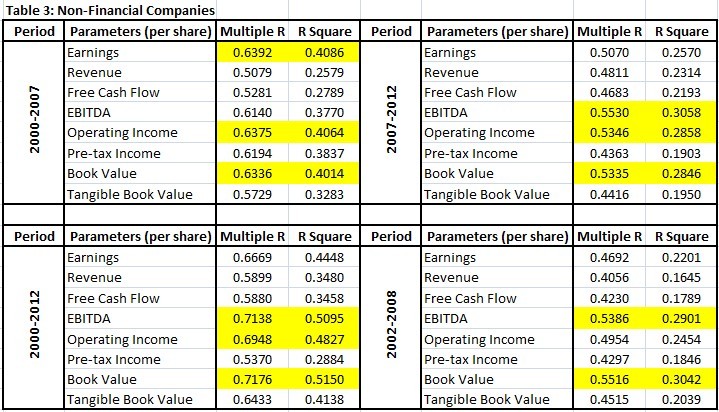
Book value remains in the top three for each of the studied periods with operating income and EBITDA being its only close competitors. If we had to choose the strongest correlating metric, however, book value is once again our front runner. Even in the two periods in which it did not have the highest correlation rating, the lag was minimal.
Yuan then studied the book value growth of these stocks, put into groups with the lowest, middle and highest initial P/B ratios. The thought was that even though some stocks traded at higher multiples, they may be higher quality firms that will grow book at a faster rate thus still outperforming the stocks with lower valuations. The fact that higher P/B stocks grew assets at a faster rate was proven to be true, but the growth failed to compensate for the initial discount offered by the lower multiple stocks. For total investor returns, the combination of growing value and price adjustment to higher P/B multiples resulted in the undervalued securities widely outperforming their more richly valued peers.
Her article goes on to fully explore the effects of earnings, revenue, free cash flow, EBITDA, operating income, pre-tax income, book value and tangible book value per share on the performances of stock prices. Despite the complexity of analysis, her finding was quite simple – price-to-book is the investment parameter with the highest correlation to stock performance.
However, one research study is not a sufficient basis from which to base our entire investment philosophy. The second test for the validity of book value superiority was constructed by Tobias Carlisle of Greenbackd, a deep value contrarian investment analyst. He back tested this topic using 87 years of equity data in his paper, ‘Investing Using Price-to-Book Value Ratio or Book Equity-to-Market Equity Multiple (Backtests 1926 to 2013)’.
Carlisle’s research examined book value to stock price correlations back to 1926. Using a 3,715 stock sample with complete financial data, stocks were grouped into a value category representing the 459 lowest price-to-book multiples and a glamour category containing the 404 highest multiples. Unsurprisingly, the value group outperformed the higher multiple glamour group for the period. The shock was the level at which this outperformance took place.
The stocks offering greater book value per investment dollar produced a compounded annual growth rate of 20.2% over the entire 87-year period and had an average annual return of 27.3%. To put this into perspective, let’s say you invested $1,000 into this strategy in 1926. Even after the Great Depression wiped out more than half of your initial investment, you would still be sitting on an estate worth almost a billion dollars today.
Barring some pretty revolutionary advances in modern medicine, most of us don’t have 87 years left to invest. But $50,000 achieving the same return for the next twenty years would still produce a $2 million nest egg. Or put a small amount into a family trust that follows the same approach and let the power of compounding go to work. Restrict the next two generations from spending it and your great grandchildren will never have to work..
Greenbackd’s study ran the same test on a portfolio weighted by market capitalization. The value instruments again outperformed, but the total return was less than that of the previously shown equal weight group.
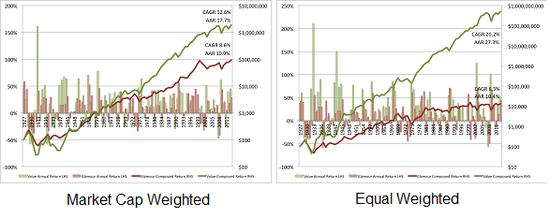
Clearly, larger stocks do not offer superior performance or additional downside protection. In fact, the market cap weighted group took 26 years to recover from the 1929 losses compared to just 15 years for the equally-weighted batch. This may be slightly off topic in our quest to find the holy metric, but it is an important fact to remember – size does NOT equal safety. Carlisle wrote:
“…market capitalization-weighted returns are useful for demonstrating that the outperformance of value over glamour is not due to the value portfolios containing smaller stocks. Unless you’re running an index (or hugging an index), they’re not really meaningful. The easiest portfolio weighting scheme is to simply equally weight each position. (If we’re prepared to put up with a little extra volatility for a little extra return, we can also Kelly weight our best ideas).”
Performance figures of the current century through 2013 are outlined in the table below:
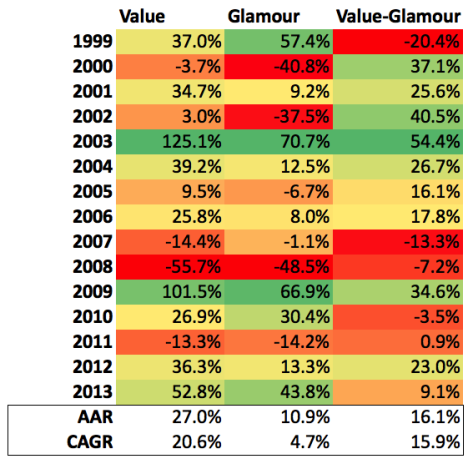
- AAR = average annual return
- CAGR = Compound Annual Growth Rate
The three groups presented are Value (lowest P/B), Glamour (highest P/B) and a combination of both. As with any investment approach, the low P/B strategy does not exceed its inverse for every 12-month period. But over a sufficient period of time, the results are abundantly clear.
Carlisle went on to perform the same study for price-to-earnings, price-to-cash flow and dividend yields but none were able to outpace the book value study.
After reviewing the research using today’s sophisticated modeling techniques and extensive financial databases, I am more aware of Ben Graham’s genius than ever. The fact that he was able to reach the same conclusions using only scratch paper and few cheap employees (Warren Buffett being one of them) is nothing short of remarkable.
We have come to the conclusion that book value and tangible book value are the most important factors in analyzing stocks for long-term performance. These case studies, along with hundreds of other books and reports compiled by the many of the greatest financial minds, all lead to this same basic conclusion.
For those wishing to employ a low price/book investment strategy, it is important to judge this metric on a relative basis. Different companies and sectors trade at different levels of book value and earnings. So instead of using an arbitrary number to cap P/B values, investors will want to identify those companies trading at historically low P/B multiples for that particular stock.
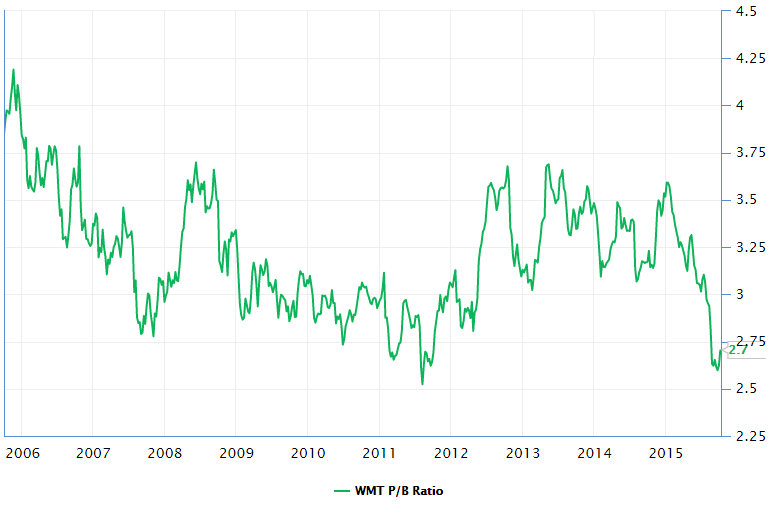
For example, take a look at the two charts below. The first shows Wal-Mart’s (WMT) P/B ratio for the last ten years. The stock tends to trade between 3 and 4 times book, so anything below 3.0 would be considered a bargain in relation to historical valuations.
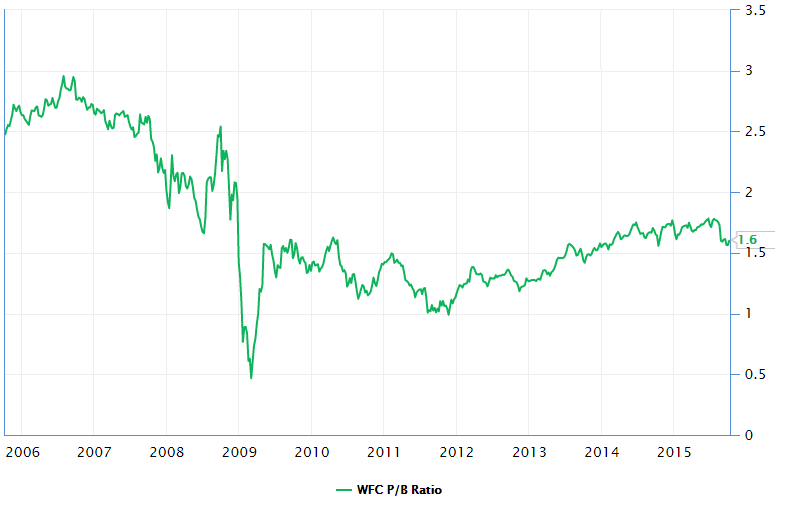
The next shows the same chart for Wells Fargo (WFC). It has typically traded at a much lower multiple of book value, so the bargain buying opportunity would be a P/B of less than 1.2 or so.
When using this method, I prefer stocks trading within 30% of their 10-year low price-to-book value. I also prefer companies with long track records (10 years or more) of proven earnings and revenue consistency. This filters out most spotty performers that have the tendency to report volatile numbers. This adds not only an additional element of safety to these low P/B candidates but also assists in above-average performance as markets tend to place a premium on more predictable stocks.
For those thinking that this topic did not need such in-depth discovery, I would have to disagree. Only by sufficiently studying and testing a thesis can we prove to ourselves the definitiveness of our findings. One must prove beyond any doubt that our methodology is sound in order to avoid abandoning it during periods of uncertainty.
Too many investors threw up their hands in 2008 and many more have ditched their convictions under the pressure of today’s reckless valuations in many hot sectors. Only be reassuring one's self of the long-term benefits of such a contrarian approach will he have the fortitude to defend his actions during unrewarding market conditions.
Let the speculators enjoy their short-lived success.
“After all, you only find out who’s swimming naked when the tide goes out.” – Warren Buffett